Showing 13 Result(s)

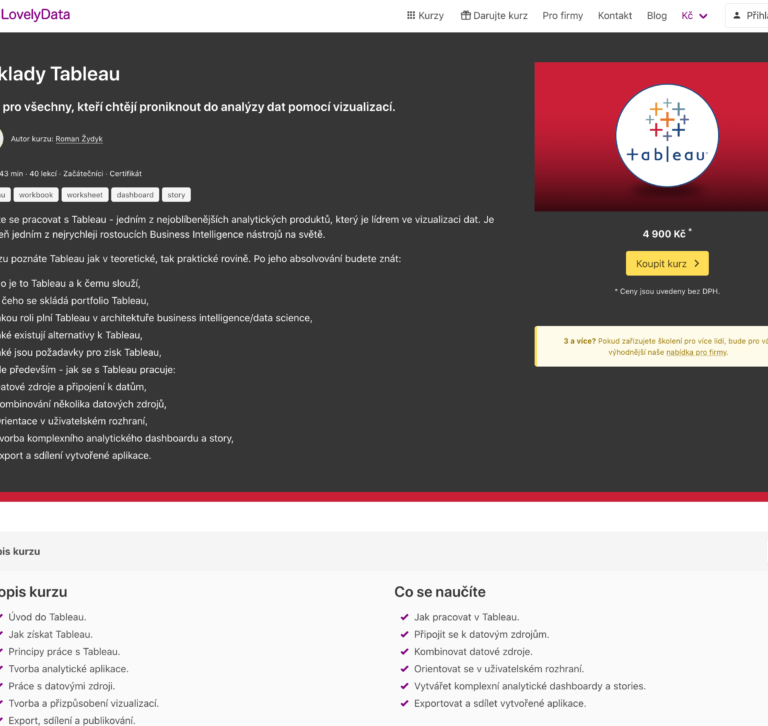
Tableau basics – online course

I created Tableau basics online course focusing on beginners. It consists of theoretical parts as well as practice. The course covers the entire dashboarding lifecycle – firstly it focuses on data loading and data preparation then creating basics visualizations, formatting these vizes, creating calculations and parameters, working with analytics functions and the last step is …

2023 Czech presidential election

I created simple web app displaying realtime results of Czech presidential election in 2023. Frontend was made using Streamlit, backend using pure python + pandas and postgres was used for storing the data. While “in production”, applications were deployed as containers using Azure Web Apps and Azure Container Instances. Postgres was hosted by Heroku. Sample …

CZ Government elections 2021

In order to have better (visual) idea of government elections in the Czech republic I created very simple Power BI report that is connected to the XML feed of the Czech statistical bureau.

Tableau basics – online class

Tableau basics online class. 143minutes of on-demand video lectures. Explained theoretical as well as practical use cases of Tableau. Created in cooperation with lovelydata. In the course you will get to know Tableau in both theoretical and practical level. After completing it, you will know: What is Tableau and what is it for, what the …

Forbes Billionaires analysis

In this analysis I took a look at the Forbes Billionaires over the past 10 years. Most of the Billionaires are Men from USA, aged 50-80 from Finance sector. During the past 10 years only Warren Buffett and Bill Gates were able to remain in the top 5. From the technical perspective I had to …

Water consumption and resources analysis

💧 – The most important liquid. How much water do we have? How much water do we use? Does everyone has access to safe drinking water? I decided to participate in the Tableau IronViz 2020 competition which is focused on Health & Wellness. I analysed water resources, water withdrawals and percentage of people with access …

Table tennis teams in the Czech republic

Part of the bachelor thesis (in Czech). Scraped data from STIS using Alteryx Designer. Data cleaned and added information about addresses (geolocation using Google Maps API). Done some analysis on data quality (also mentioned in bachelor thesis) and overall analysis of table tennis teams location in the Czech republic. Useful for players, fans, clubs or …

Women in parliaments

How many women are in parliaments? Week 30 of the #makeoverMonday focused on number of women in parliaments. Historically, ~1 of 10 parliament members was a woman. As of 2019 the situation got a little bit more diverse with almost every 4th parliament member being a woman. Despite the fact that few countries did a …

Penguins infographics

Can you differentiate between penguin species? 🐧 Wait, what? Well, for the week 28 of #makeovermonday we got penguin species dataset with attributes like bill depth and length, body mass and flippers length. I analysed data a bit and the result (and my first ever attempt for the #makeoverMonday) you can see below. As we …

en_US